Fun With R & Leaflet
As part of the Coursera Developing Data Products course I took recently we were asked to produce an example of an interactive R markdown document using Leaflet.
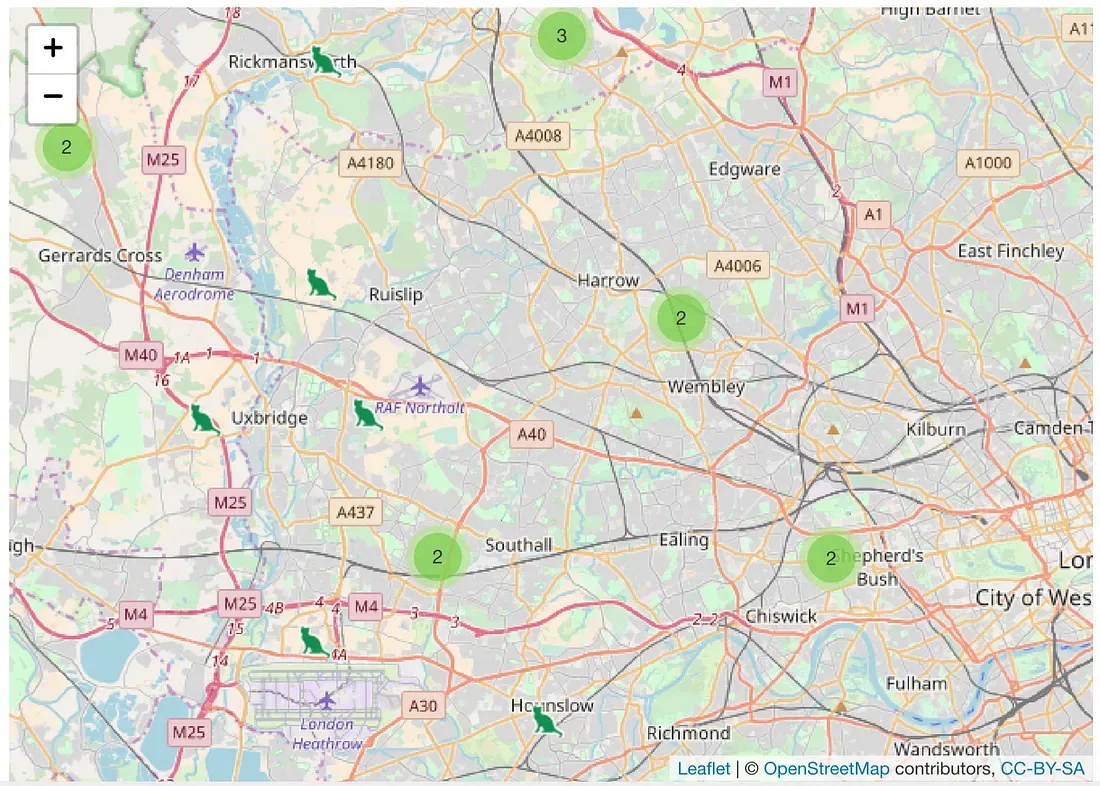
So I generated some random cat sightings in and around London, piped them into Leaflet and it produces this sort of map:
The map automatically clusters the cat locations so that as you zoom in the clusters expand into individual kitties; zoom out and they merge into clusters again, showing their counts.
There really is very little code involved; the R leaflet package takes care of most of the legwork. Here is the one liner that generates the map:
cat_coords %>% leaflet() %>% addTiles() %>% addMarkers(icon = catIcon, popup = catWikiPages, clusterOptions = markerClusterOptions())
The source is available on GitHub.